

Weekly Market Outlook: Trigger Uncertainty, Nasdaq in Correction & US CPI Data Ahead
Read More: Bitcoin’s (BTC/USD) Wild Ride – Open Interest, ETF Flows Amid Trump’s Crypto Remarks
Week in Review: Fear is Rising but US Labor Market Remains Steady for Now
Markets have struggled this week as fears are rising. Wall Street is on edge as investors say the Trump administration’s mixed signals on rolling back tariffs are creating confusion instead of easing concerns.
The S&P 500 has dropped 4.3% since President Trump took office on January 20, with tariffs being a major worry for investors. Many believe tariffs could hurt economic growth and lead to higher prices.
On Thursday, stocks faced a sharp selloff after Trump announced a one-month exemption for Canada and Mexico from the 25% tariffs he introduced earlier in the week. The Nasdaq fell 2.6% that day and has been in a correction since its record high on December 16.
This latest tariff move gave limited relief to stocks, as Wall Street remains unsure about how a tariff-driven trade policy might affect the economy.
The Nasdaq 100 has now officially entered corrective territory with losses of 10% from its all time high.
Trump believes tariffs can boost revenue, growth, and help in negotiations with other countries. However, investors are worried they may hurt consumer confidence and cause businesses to hold back on spending.
Sources: LSEG Datastream
A brief pause came on Friday with the US jobs data release. The U.S. added 151,000 jobs last month, according to the Labor Department, following a revised increase of 125,000 jobs in January. Economists had predicted a rise of 160,000 jobs, compared to the earlier reported January figure of 143,000.
On the FX Front the dollar showed its vulnerabilities and is on course for its worst week in over a year. The dollar has dropped about 5% since President Trump took office in January and is now at a four-month low.
Concerns about U.S. growth, fueled by trade tariff news, have hurt the dollar. Meanwhile, Germany’s boost in spending has improved Europe’s economic outlook, leading investors to move their money to economies with stronger growth prospects.
The chart below shows how speculators have slashed their bets on a bullish US Dollar in recent weeks.
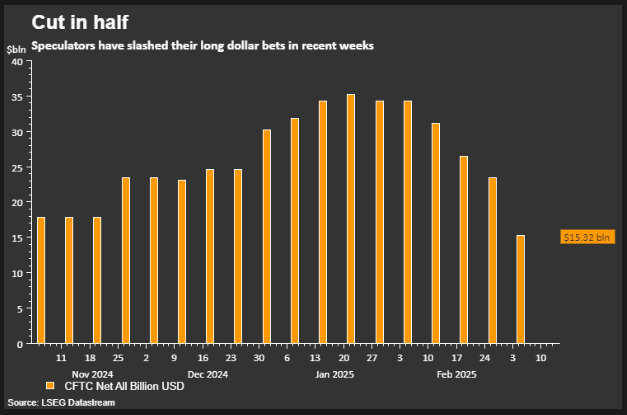
Source: LSEG
On the commodities front, Gold has rebounded this week to trade back above the $2900/oz mark, but continues to struggle to pierce through resistance at the $2924 handle. As we have discussed for weeks now, the geopolitical situation coupled with tariff uncertainty is likely to keep the precious metal supported.
Oil prices faltered this week thanks to the OPEC+ announcement and growth fears. For a full breakdown read Brent Oil Price Analysis: Six-Month Lows Amid OPEC Output, Tariffs & Russia-Ukraine Negotiations
The Week Ahead: Tariffs at the Forefront. Will Trump Follow Through?
Asia Pacific Markets
The main focus this week in the Asia Pacific region for me is China’s Two Sessions and inflation data.
China’s Two Sessions ends next Tuesday, with key policy updates expected on stimulus and reforms. February inflation data is due Sunday, and the Lunar New Year impact may push consumer inflation to -0.3% year-on-year, while producer inflation is also expected to stay negative. Credit data for February is expected next week, with markets predicting higher overall financing and new loans in RMB.
In Japan, I do expect growth in labor earnings to slow, mainly due to smaller bonus payments. January’s inflation spike will likely push real earnings into the negative. Fourth quarter GDP may be revised down from 0.7% to 0.5% because capital spending was weaker than expected.
Markets are still focused on Japan as further interest rate hikes from the Bank of Japan remain on the table.
Europe + UK + US
In developed markets, the US inflation is back in the limelight. The data however, might be overshadowed once more by the ongoing tit-for-tat tariff developments which are set to continue.
U.S. consumer price inflation is expected to remain high in the coming week, with a 0.3% month-on-month increase forecasted. Business surveys show some companies are raising prices ahead of potential tariffs. Food and energy costs are also pushing inflation higher, even though gasoline prices have recently dropped.
However, markets are currently more concerned about slowing growth, government spending cuts, and the risk of reduced purchasing power if tariffs lead to higher prices. Over the past three weeks, expectations have shifted from predicting one small rate cut this year to three. A 0.3% inflation figure is unlikely to change this outlook.
The EU and UK have a bit of breather on the data front next week with a speech by ECB President Christine Lagarde on Wednesday the highlight.
The Bank of Canada has already cut rates by 200 basis points due to weak growth and low inflation. U.S. tariffs on Canadian imports are adding fears of a recession. Governor Macklem warned that a long trade conflict could severely damage the economy, which their models show would shrink before recovering on a path 2.5% below earlier forecasts.
Since 76% of Canadian exports go to the U.S., equal to 20% of GDP, the risks are high. With 6.6% unemployment and 1.9% inflation, the BoC may cut rates by another 25 basis points on Wednesday.
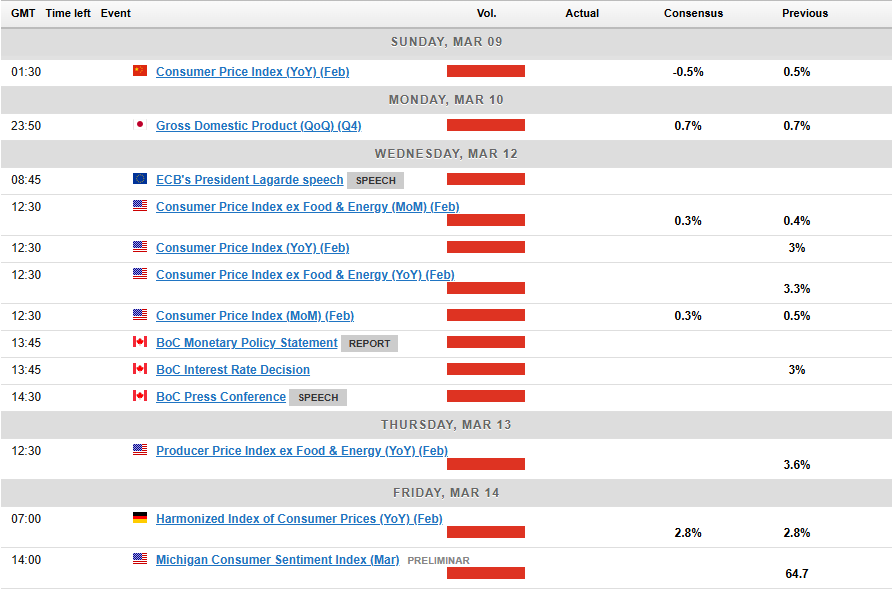
For all market-moving economic releases and events, see the MarketPulse Economic Calendar. (click to enlarge)
Chart of the Week
This week’s focus is on the Nasdaq 100 chart as the index had fallen as much as 10% from its all time highs this past week.
Friday did however bring a significant recovery from the weekly low of 19733, with the index rising to trade at 20131 at the time of writing. That is a near 2% percent rise from the weekly low.
Is this a temporary pullback or are the bulls finally back?
Time will tell, but given the amount of uncertainty and concerns from companies, there is a real possibility that there may be more downside ahead.
Immediate resistance rests at the 20326 handle which also houses the 200-day MA and could prove a tough nut to crack. If the index is capable of recording a daily candle close above this level then a run toward 20484 and 20790 become a real possibility.
A break of the psychological 20000 handle though could be key and could lead to a longer term selloff down to the mid 18000’s.
Support may be found at 19750 and 19123.
Nasdaq 100 Daily Chart – March 7, 2025

Source:TradingView.Com (click to enlarge)
Key Levels to Consider:
Support
Resistance
Follow Zain on Twitter/X for Additional Market News and Insights @zvawda
Content is for general information purposes only. It is not investment advice or a solution to buy or sell securities. Opinions are the authors; not necessarily that of OANDA Business Information & Services, Inc. or any of its affiliates, subsidiaries, officers or directors. If you would like to reproduce or redistribute any of the content found on MarketPulse, an award winning forex, commodities and global indices analysis and news site service produced by OANDA Business Information & Services, Inc., please access the RSS feed or contact us at info@marketpulse.com. Visit https://www.marketpulse.com/ to find out more about the beat of the global markets. © 2023 OANDA Business Information & Services Inc.


